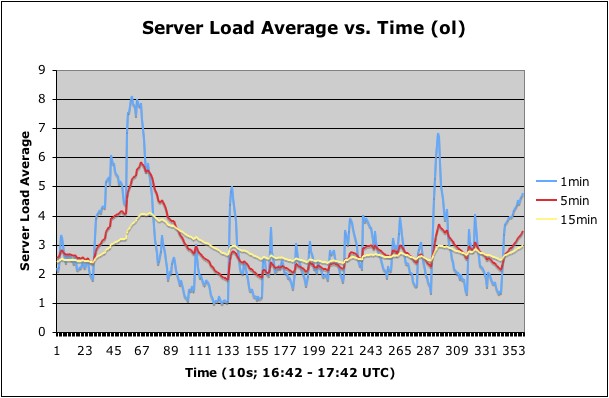
Average: 2.91, 2.89, 2.81 Range: 7.14, 4.06, 1.72
The SDF system consists of nine mini computers, of which seven are user accessible. Load averages of all nine systems are availabe, to the users, and can be used to infer the busyness of these systems. For this report, the three load averages of each machine was recorded every ten seconds for one hour, between 4:42 to 5:42 pm UTC, on February 4, 2005. Below are the graphical results of those recordings.
The graphs reveal interesting patterns in the server usage. Most of the servers hovered around 2.50 on average, however, ukato had especially been busy today, averaging out to 4.34 during that hour, and previously, it had been in the 6 to 7.5 range, early in the day. Ukato only had 34 users, however, sdf had 71. One explaination could be that there were more server processes running on ukato, than any other server. On the other hand, top didn't reveal any big resource hogs.
Droog has lower averages, due to the exclusivity to SDF-EU members only, and its lower amount of users. Droog however, has the biggest spikes, than the other servers.
Finally, vinland has the lowest numbers of the entire cluster. Due to it being a testing server, vinland has very few users. Usually, it doesn't get more than 8. Since vinland is almost empty, it has the most flat 15 min averages. The graph shows a lot of spikes, however, the range for the 1 minute average, is the smallest of the cluster.
Update: To be complete, I've added the script at the bottom of this page as a reference. After showing this page to a few fellow SDF members, they showed me another system that collects better stats than this does. Although, MTRG does a better job at collecting load data, and other data, it doesn't collect the number of users online at any point, so that might be another area that I could cover.
It was fun when I created the script, but with the amount of time it takes to hand create the graphs in Excel, I don't think I'll be doing this more often than a casual exploration of the topic, and this system definitely will not become an automatic system. Anyways, enjoy the graphs below.
[OL] [MX] [SDF] [OTAKU] [UKATO] [NORGE] [DROOG] [SVERIGE] [VINLAND] [*DATA] [SCRIPT] [HOME]
#!/usr/pkg/bin/zsh

#A Script to do stats on load numbers for the servers.
#Created by Ronald Roberts
#5/9/2005

STATCOUNTER=0 #Used as an internal counter.
STATSAMPLES=5 #Determines how many samples to take.
STATSLEEP=2   #Determines the time to sleep between each sample.
STATDIR=$HOME/stat #Where to store the data files.

if [[ ! -d $STATDIR ]] #STATDIR can't exist, or the script will quit.
then
	mkdir $STATDIR
else
	echo "$STATDIR exists. Can't Continue.";
	exit;
fi

while (true) do               #Takes the actual samples.
ruptime >> $STATDIR/stat.dat
let STATCOUNTER=$STATCOUNTER+1
if [[ "$STATCOUNTER" -gt "$STATSAMPLES" ]]
then
	break;
fi
sleep $STATSLEEP
done

function filterf {
cat $STATDIR/stat.dat | grep $1 >> $STATDIR/${1}.dat
cat $STATDIR/${1}.dat | awk '{ print $7 $8 $9 }' | sed -e "s/\,/ /g" >> $STATDIR/${1}.dat.t
mv $STATDIR/${1}.dat.t $STATDIR/${1}.dat
}

#Filters the stats for each server into its own file.
filterf ol
filterf mx
filterf sdf
filterf otaku
filterf ukato
filterf norge
filterf droog
filterf sverige
filterf vinland

function filterc {
cat $STATDIR/${1}.dat | awk '{ print $1 }' >> $STATDIR/${1}.dat.1
cat $STATDIR/${1}.dat | awk '{ print $2 }' >> $STATDIR/${1}.dat.5
cat $STATDIR/${1}.dat | awk '{ print $3 }' >> $STATDIR/${1}.dat.15
}

#Seperates each server's data into different fiels for the three averages.
filterc ol
filterc mx
filterc sdf
filterc otaku
filterc ukato
filterc norge
filterc droog
filterc sverige
filterc vinland